
Dynamics NAV to Business Central Data Migration
Upgrading from Dynamics NAV to Business Central? Mine automates the mapping between NAV's C/AL table structures and BC's AL-based data model — preserving G/L history, customer ledger entries, item tracking, and custom table extensions.
Working with enterprise teams on active migration programs
3–6 weeks
to production-ready mappings
40–50%
cost reduction vs. manual migration
90%+
average mapping confidence
Most enterprise migrations start 6+ months behind schedule. Yours doesn't have to.
This guide is for VPs of IT, data architects, and migration leads at companies moving data from Dynamics NAV to Microsoft Dynamics 365 Business Central — whether you're scoping, planning, or mid-program.
Dynamics NAV stores data in C/AL tables — Table 18 (Customer), Table 23 (Vendor), Table 27 (Item), Table 17 (G/L Entry) — with custom fields added through C/AL extensions and industry-specific ISV add-ons. Business Central uses the same core table numbers but runs on AL extensions with a different data type system, dimension handling, and API layer. Mine maps NAV's C/AL schema to BC's AL model automatically, including custom table extensions and ISV data.
Based on enterprise migration programs led by Mine's founding team
Last updated March 2026
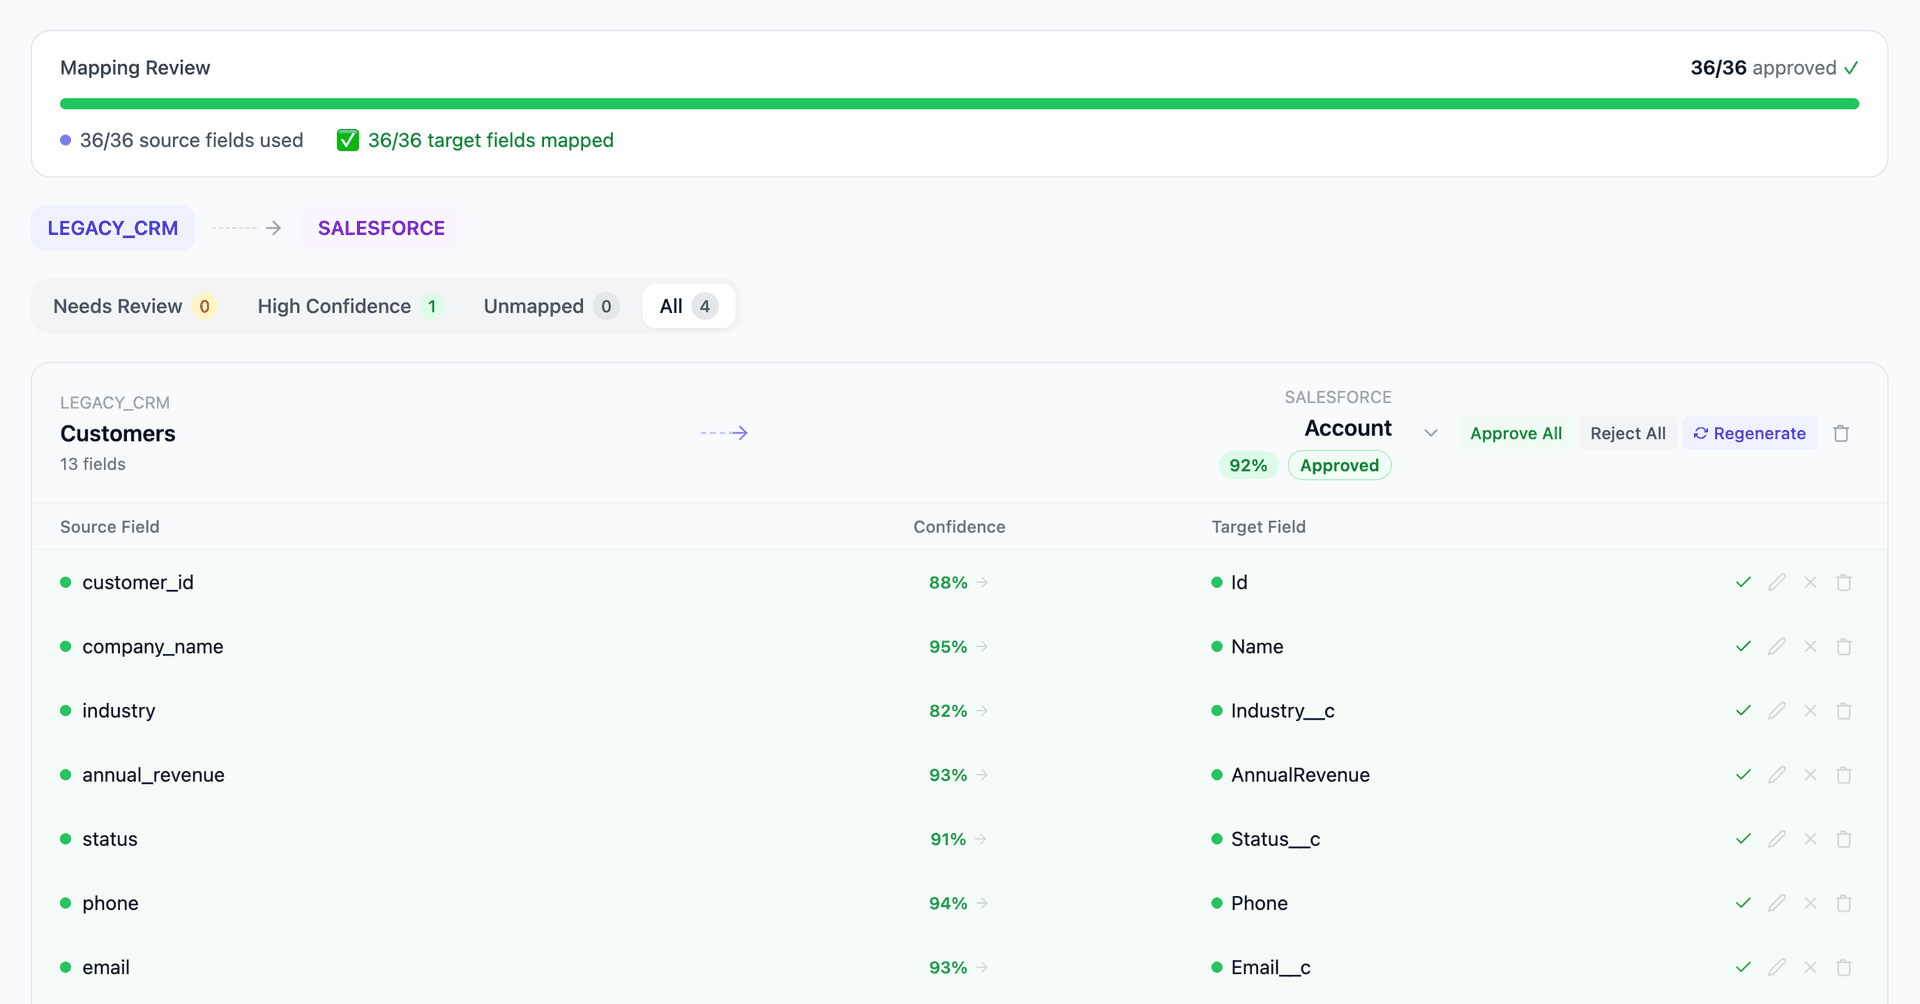
How Mine automates your Dynamics NAV to Microsoft Dynamics 365 Business Central migration
Mine profiles your entire NAV database — base tables, custom tables in the 50000–99999 range, and ISV add-on tables — and maps each to the corresponding Business Central structure with field-level type translation.
Custom C/AL fields on base tables are identified and mapped to BC AL extension fields, generating a complete extension inventory for the development team.
Dimension set entries are validated across all ledger tables (G/L, Customer, Vendor, Item) to catch dimension inconsistencies before they become post-migration reconciliation issues.
Mine generates the transformation logic for number series alignment, document cross-references, and ledger entry date filtering — so the migration team starts with working SQL, not a blank spreadsheet.
Get your Dynamics NAV to Microsoft Dynamics 365 Business Central mapping analysis — see results in under an hour
Migration timeline: manual vs. Mine
Traditional approach
Timeline
4–12 months
Estimated cost
$150K–800K
Team size
3–8 NAV/BC consultants
Typically requires
×Manual field mapping in spreadsheets
×Custom ABAP/SQL extraction scripts
×3–5 mock migration cycles
×Dedicated source system consultants
×Manual reconciliation testing
With Mine
Enterprise benchmarksTimeline
3–6 weeks
Team size
1–3 internal resources
Estimated cost
40–50% less
Included
✓Schema profiling & analysis
✓AI-generated field mappings
✓Transformation SQL
✓Validation & readiness reports
✓Production-ready load files
Common challenges migrating from Dynamics NAV to Microsoft Dynamics 365 Business Central
C/AL custom objects to AL extensions
NAV implementations contain custom tables (50000–99999 range), custom fields on base tables, and modified code units written in C/AL. Business Central requires these as AL extensions. Mine profiles every custom table and field in the NAV database, maps them to BC's extension model, and flags objects that have no BC equivalent — giving the implementation team a complete inventory before a single line of AL is written.
Explore related migrations →ISV add-on data migration
Most NAV instances include ISV solutions — Jet Reports, Insight Works warehouse modules, Lanham Associates EDI, Continia Document Capture — each with their own tables and data. Some ISVs offer BC versions; others don't. Mine identifies all ISV tables in the NAV database and maps them to their BC equivalents or flags them as requiring manual migration or replacement.
Explore related migrations →G/L entry and ledger history volume
NAV databases that have been in production for 10–20 years contain millions of G/L entries (Table 17), customer ledger entries (Table 21), vendor ledger entries (Table 25), and item ledger entries (Table 32). Migrating this full history into BC requires careful scoping — most companies migrate detailed entries for 3–7 years and opening balances for older periods.
Explore related migrations →Dimension handling differences
NAV uses Global Dimensions 1–2 on transaction tables and a Dimension Set Entry table (Table 480) for additional dimensions. BC uses the same structure but enforces dimension consistency differently. Misaligned dimension set IDs between NAV and BC are one of the most common causes of post-migration G/L discrepancies. Mine validates dimension set integrity across all ledger entry tables before migration.
Explore related migrations →Number series and document references
NAV uses number series for document numbering — sales invoices, purchase orders, journal batches. BC requires these number series to be configured and synchronized to avoid gaps or duplicates. Cross-references between posted documents and their original orders must also be preserved to maintain the audit trail.
Explore related migrations →Dynamics NAV to Microsoft Dynamics 365 Business Central field mapping — what data moves
12 data objects typically migrated
| Source Object | → | Target Object |
|---|---|---|
| Table 18 (Customer) | → | Customer (Table 18) |
| Table 23 (Vendor) | → | Vendor (Table 23) |
| Table 27 (Item) | → | Item (Table 27) |
| Table 17 (G/L Entry) | → | G/L Entry (Table 17) |
| Table 21 (Cust. Ledger Entry) | → | Cust. Ledger Entry (Table 21) |
| Table 25 (Vendor Ledger Entry) | → | Vendor Ledger Entry (Table 25) |
| Table 32 (Item Ledger Entry) | → | Item Ledger Entry (Table 32) |
| Table 36/37 (Sales Header/Line) | → | Sales Header/Line |
| Table 38/39 (Purchase Header/Line) | → | Purchase Header/Line |
| Table 480 (Dimension Set Entry) | → | Dimension Set Entry (Table 480) |
| Table 5050 (Contact) | → | Contact (Table 5050) |
| Custom Tables (50000–99999) | → | AL Extension Tables |
Typical enterprise migrations include 500K–10M+ records across these objects. Mine handles profiling and mapping at any scale.
The cost of manual Dynamics NAV to Microsoft Dynamics 365 Business Central migration
These migrations are typically run by NAV/BC partners (VARs) over 4–12 months. The data migration workstream — mapping NAV tables to BC, handling custom fields, converting dimensions, and preserving ledger entry history — consumes 30–40% of the total project effort.
Frequently asked questions
Related migration paths
In one enterprise migration, a single field mapping error in customer master data caused $100K in billing discrepancies that went undetected for 6 months.
Mine catches these issues before they reach production.
Built by a team that led SAP, Oracle, and Salesforce data migration programs for Fortune 500 companies at a Big 4 consulting firm. Currently in design partnership with enterprise clients running active migration programs.
Ready to migrate from Dynamics NAV to Microsoft Dynamics 365 Business Central?
Tell us about your migration and we'll show you how Mine can help.
No commitment required. We'll review your migration scope and share a preliminary assessment within 48 hours.
You'll receive a preliminary mapping analysis showing how your source objects map to your target schema, with confidence scores and flagged risk areas.